October 12, 2005
Martin Wattenberg lecture at SIMS

Martin Wattenberg is one of my heroes. He's a information visualization guy, and I've been following his stuff for about as long as I've been maintaining this site (that's since 1998...). Even if you're not an infoviz nerd, you've still probably seen his NameVoyager, which shows trends in baby names since 1880.

This afternoon, he gave a "distinguished lecture" talk at UC Berkeley, the Social Life of Visualizations. In it, he recapped his greatest hits, and talked about what he found interesting. Here are my (slightlly edited, and hyperlinked) notes.
Visualizations from a social point of view
Early brilliant visualizations...
Example 1 - 1787 Ernst Chladni
Interested in acoustics.
He conducted an experiment. He was curious about vibrations. He took a metal plate, covered it in sand, stroked with violin bow, and saw sand arranges in patterns.

Image from here.
Gave demo to Napoleon.
Napoleon offered prize to anyone who could explain the pattern.
The prize was awarded to mathematician Sophie Germain.
Example 2 - Vietnam Veterans Memorial 1982 - Maya Lin
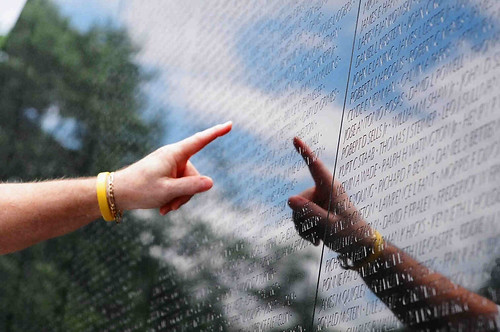 Image from here.
The wall is not only an amazing information visualization, it is also effective at bringing people together... "outside" the visualization.
Segue
Martin has found that his visualizations encouraged conversations.
Map of the Market
He developed the map of the market at Smart Money. He noticed it would be brought up to start a conversation, to have a conversation.
History Flow

History flow came about as a visual exploration of a collaboration mystery
They were looking at Wikipedia, where anyone can mess with any page, and the mystery is that the pages seem pretty good.
So they tried to analyze why it should work.
There's a mother lode of data... All of the revisions are left on line.
For every single change made, you get the text of the change, who changed it, some kind of comment.
To make looking at the versions manageable, came up with History Flow
You represent each version by vertical line.
Length of line shows length of document.
Color code contributors.
Connect matching sections across versions.
Link those sections with text...
(it's all explained here)
[He then demonstrates this with pages on wikipedia... simple one like the history of IBM.
You can read what he talked about here.
more complex, like "cat". many more people modified the page.
Microsoft has hordes of contributors.
Controversial pages get all kinds of traffic... You can "visualize" controversy.
Their work demonstrated the vandalism and self-healing properties at Wikipedia.
When people would talk about vandalism on wikis, and how quickly the wikis recover, they would refer to the pictures in history flow.
Something about showing the pictures that made people believe.
Apartment
Building a city of words and memories (with Marek Walczak)The apartment is a toy/visualization where
the idea is to take words and turn them into buildings.
As people type and hit return, it would put the words into rooms they might correspond to
loosely inspired by memory palaces.
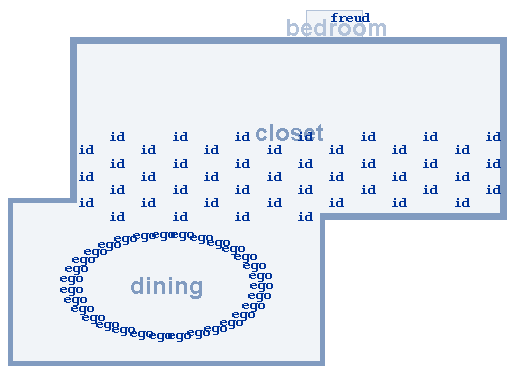
He shows some interesting apartments. One utilizes the word "id" over and over, the word "ego" over and over" and a single use of the word freud. Try it out to see what happens.
They thought the value would be in the art of building rooms. The real value has proven to be the clever ways people manipulate the program to express themselves. In using the program, people recognize patterns... and exploit those patterns. There are feedback loops.
Thinking Machine Series
watching a chess-playing computer think
It's a program that draws the decision tree the computer is "thinking" about
Social Data Analysis
When is statistical analysis like a game?NameVoyager
Martin's wife published a book on baby names... instead of just etymology, it looks at statistics of name user, gotten from the Social Security Administration.
This tool surprisingly became popular.
Do a google search on "namevoyager"-- 39,800 results.
He went to see what people are talking about.
People are talking about it at great length.
Conversations back and forth.
It was not the audience we expected. It was a lot of people not having babies...
On a blog, he saw people turn it into a game:
"find a name that was popular, went away, then came back."
And people responded with "grace" and "porter".
or, "find the steadiest popular name."
What's amazing is that people are proposing complex hypotheses... and are engaged in data mining challenges.
--> this is more sophisticated stat analysis then martin ever sees in the new york times
--> it's neat that people are doing this, beyond what martin ever expected
Whereas a company called Financial Engines couldn't get people to use their 401k visualization...
--> couldn't get people to explore huge amounts of information
Analogy with games
There seems to be an analogy with games in what we saw with Namevoyager.Richard Bartle, in writing about MUDs, came up with four types of players. This corresponds to behaviors seen with Namevoyager.
1. Achievers
-- "this is perfect, as baby names weigh heavily on my mind these days"
2. Socializers
-- "runes name doesn't show up at all... but my name has suddenly gotten popular... I HATE IT FIRST! heh"
3. Explorers
-- ETH. LAT. (type these letters into the namevoyager to see interesting graphs.)
4. Killers.
-- "It is also damn entertaining to me, that I can type in "Lexus" and find that people actually name their kids Lexus... from youandwhosearmy.com
Conclusion
What does it mean to Design for Social Data Analysis. "Audience interfaces": good after all (in contrast to what Jakob Nielsen, said, where he criticized an interface for not being a user interface, but an audience interface, great for movies or tv... great for star trek, but not for a user. Martin's point is that our interfaces need to get more audience-friendly, as these visualizations can appeal to many, and engage many. We need to rethink that... more and more, more than one person around the screenWe need to make the UI "expressive" (see Reeves et al, CHI 2005)
We need to arrange for both unique perspective and common ground
- may depend on data
- we should also consider "anti-social" navigation; emphasize the road less traveled
The success of Namevoyager seems to hinge on the fact that everyone has a point of entry ... everyone types in their own name, or kids name, someone they know.
-----------------------
Then there was Q&A, and I didn't take any more notes.
Technorati Tags: visualization, wattenberg, ucberkeley
