I’ve been invited to give the keynote at the upcoming About, With and For Conference, October 17 and 18 at IIT’s Institute of Design in Chicago.
The conference invites folks from business, design (isn’t design part of business?), and social sciences to discuss methods for synthesizing user research. They’ve put together a top-notch list of speakers, (which makes me wonder how a young turk such as myself is giving the keynote!). And it’s pretty cheap, as conferences go (the highest price is $200).
In my presentation, I’ll be discussing models we’ve developed at Adaptive Path for synthesizing user research (such as the mental model described in this case study). However, I realized I didn’t want this to be just about the work I’ve done. I wanted to place these efforts in an historical context, both within HCI and from a range of disciplines that have developed methods for analyzing observed or inferred human behavior.
Human Behavior Models in HCI
For me, the standard-bearers of HCI modeling are Hugh Beyer and Karen Holtzblatt, whose various work models are, I believe, the backbone of their contextual design methodology. I attended their class at CHI ’98, and light bulbs went off when I saw how they turned mushy user research data into solid models from which you could design.
An excellent reproduction of the models from Beyer and Holtzblatt’s book can be found here.
On another note, I would be remiss if I didn’t mention Alan Cooper’s work with personas and scenarios. Though not diagrammatic, they serve the purpose of distilling observations into a form you could then utilize in design — the persona.

Archaeologists Analyze the Past
One place I’ve found some interesting diagrammatic analyses is in the field of archaeology. Archaeologist James Deetz turned the discipline upside-down with his seminal essay, Death’s Head, Cherub, Urn and Willow, which charted the stylistic evolution of gravestones in colonial New England. There are two depictions of note. The first is the “battleship” diagram, showing popularity of styles over time:

Never before had such a statistical representation been brought to bear on material culture over time. As Deetz asks later in the essay, “what does this mean in terms of culture change? Why should death’s heads be popular at all, and what cultural factors were responsible for their disappearance and subsequent rise of the cherub design?” These are the kinds of questions opened up once you witness the data in this synthesized form.
The second clever representation depicts the branching trees in the stylistic evolution:

Though this doesn’t have the simple classic qualities of the battleship diagram (it’s wedded to its context, whereas the battleship could be applied to any number of situations), it assists in analysis of the subject.
Another archaeological analytical model is the Harris Matrix. Developed to understand complex stratigraphy in big digs, it’s a boxes-and-arrows system that will seem familiar to any information architect.

I won’t get into details, but suffice to say that boxes represent different layers, and that the older layers are beneath the newer layers. As an Harris Matrix evolves, it not only helps archaeologists make sense of what they’re seeing (and make sure they keep things in the right order), it eventually becomes a tool by which others, even those who aren’t archaeologists, can understand what is happening underground.
Analyzing what humans have left behind makes me wonder if similar models will begin to make sense as we build a record of what humans have done online.
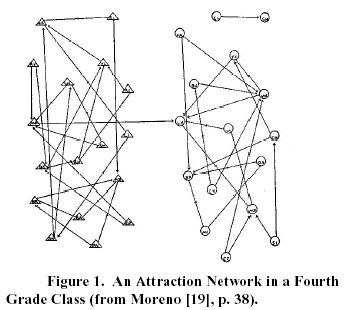
Social Network Analysis – The Socio-Gram
Another group that’s developed an interesting model for considering human behavior or social network analysts. Which makes sense — it’s hard to understand a social network without some boiled-down depiction of it.

I’ve written about SNA in the past, and won’t repeat myself here.
Anyway, one reason I’m posting all this is to see if you good people who read my blathering have other examples of systems of synthesis of observed human behavior that would make a good subject in such a talk. I have to imagine that sociologists, anthropologists, psychologists, cognitive scientists, business people, anyone who has to consider what people do and make sense of it in some fashion, have their own ways of depicting such analyses. Pointers?
Young turk? As of next week it’s more like old turkey.
This is next week. Happy Birthday, Pal!